Tiếng Anh 7 Unit 1 CLIL - Maths: Data and charts
1. Check the meaning of the words in the box and match them with A–E in the charts. 2. Read and listen to the text. What information does the pie chart NOT give? 3. Study the charts. Then choose the correct words in the reports. : 4. USE IT! Draw a bar chart for the data in the chart below.
Bài 1
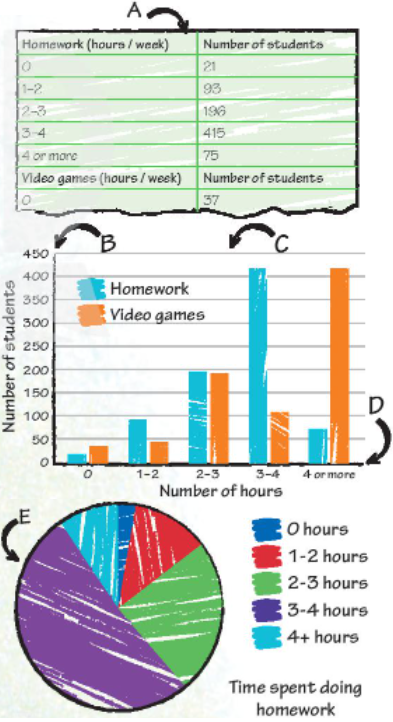
1. Check the meaning of the words in the box and match them with A–E in the charts.
(Kiểm tra nghĩa của các từ trong hộp và ghép chúng với A – E trong biểu đồ.)
|
bar chart (biểu đồ cột) pie chart (biểu đồ tròn) data chart (biểu đồ dữ liệu) y-axis (trục y) x-axis (trục x) |

Lời giải chi tiết:
A. data chart (biểu đồ dữ liệu)
B. y-axis (trục y)
C. bar chart (biểu đồ cột)
D. x-axis (trục x)
E. pie chart (biểu đồ tròn )
Bài 2
2. Read and listen to the text. What information does the pie chart NOT give?
(Đọc và nghe văn bản. Biểu đồ tròn KHÔNG cung cấp thông tin gì?)
Study and free time survey
Do you spend more time doing homework or playing video games? A lot of students think that they spend more time doing homework. But is this true? My class did a survey to check. In the survey, we asked students the number of hours they spend doing homework and playing video games every week.There are 800 students in our school. We asked all the students two questions:
How many hours do you spend doing homework every week?
How many hours do you spend playing video games every week?
We presented the data in three different charts. Here are the results.

Phương pháp giải:
Tạm dịch:
Khảo sát thời gian rảnh và học
Bạn có dành nhiều thời gian hơn để làm bài tập về nhà hoặc chơi trò chơi điện tử không? Rất nhiều học sinh nghĩ rằng họ dành nhiều thời gian hơn để làm bài tập. Nhưng điều này có đúng không? Lớp tôi đã làm một cuộc khảo sát để kiểm tra. Trong cuộc khảo sát, chúng tôi hỏi học sinh số giờ họ dành để làm bài tập về nhà và chơi trò chơi điện tử mỗi tuần. Có 800 học sinh trong trường của chúng tôi. Chúng tôi hỏi tất cả các học sinh hai câu hỏi:
Bạn dành bao nhiêu giờ để làm bài tập về nhà mỗi tuần?
Bạn dành bao nhiêu giờ để chơi trò chơi điện tử mỗi tuần?
Chúng tôi đã trình bày dữ liệu trong ba biểu đồ khác nhau. Đây là kết quả.
|
Homework (hours / week) (Bài tập về nhà (giờ / tuần) |
Number of students (Số lượng học sinh) |
|
0 |
21 |
|
1-2 |
93 |
|
2-3 |
196 |
|
3-4 |
415 |
|
4 or more (4 hoặc nhiều hơn) |
75 |
|
Video games (hours / week) (Trò chơi điện tử (giờ / tuần)) |
Number of students (Số lượng học sinh) |
|
0 |
37 |
Lời giải chi tiết:
The pie chart doesn't give information about the time students spend on playing video games.
(Biểu đồ hình tròn không cung cấp thông tin về thời gian học sinh dành để chơi trò chơi điện tử.)
Bài 3
3. Study the charts. Then choose the correct words in the reports.
(Nghiên cứu các biểu đồ. Sau đó chọn các từ đúng trong các báo cáo.)
Homework time
(1) Most / A small number of students do no homework at all. Nearly (2) a quarter / half of the students do between two and three hours of homework. More than half of the students do more than (3) three / four hours of homework a week.
Video games time
(4) Under / Over 30 students never play video games. More than half of the students spend over (5) three / four hours playing video games. Nearly (6) one hundred / two hundred students spend between two and three hours playing video games every week.
Lời giải chi tiết:
|
1. A small number of |
2. a quarter |
3. three |
|
4. Over |
5. four |
6. two hundred |
Homework time
(1) A small number of students do no homework at all. Nearly (2) a quarter the students do between two and three hours of homework. More than half of the students do more than (3) three hours of homework a week
Video games time
(4) Over 30 students never play video games. More than half of the students spend over (5) four hours playing video games. Nearly (6) two hundred students spend between two and three hours playing video games every week.
Tạm dịch:
Thời gian làm bài tập
Một số ít học sinh không làm bài tập về nhà. Gần một phần tư số học sinh làm bài tập về nhà từ hai đến ba giờ. Hơn một nửa số học sinh làm bài tập về nhà hơn ba giờ một tuần
Thời gian trò chơi điện tử
Hơn 30 học sinh không bao giờ chơi trò chơi điện tử. Hơn một nửa số học sinh dành hơn bốn giờ để chơi trò chơi điện tử. Gần hai trăm học sinh dành từ hai đến ba giờ để chơi trò chơi điện tử mỗi tuần.
Bài 4
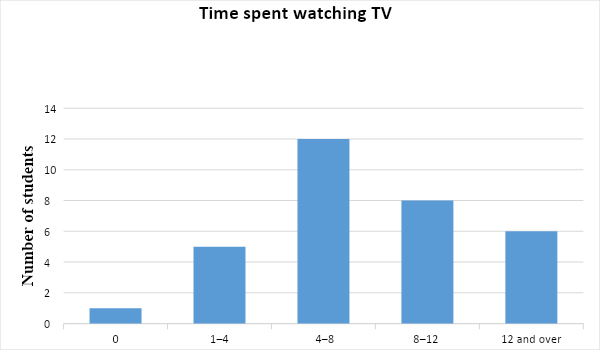
4. USE IT! Draw a bar chart for the data in the chart below.
(THỰC HÀNH! Vẽ biểu đồ thanh cho dữ liệu trong biểu đồ bên dưới.)
|
Watching TV (hours / week) (Xem TV (giờ / tuần)) |
Number of students (Số lượng học sinh) |
|
0 |
1 |
|
1-4 |
5 |
|
4-8 |
12 |
|
8-12 |
8 |
|
12 and over (12 và hơn) |
6 |
Lời giải chi tiết:
